
The Iterative Eight Steps for Solving Problems – Step 5: Analyzing
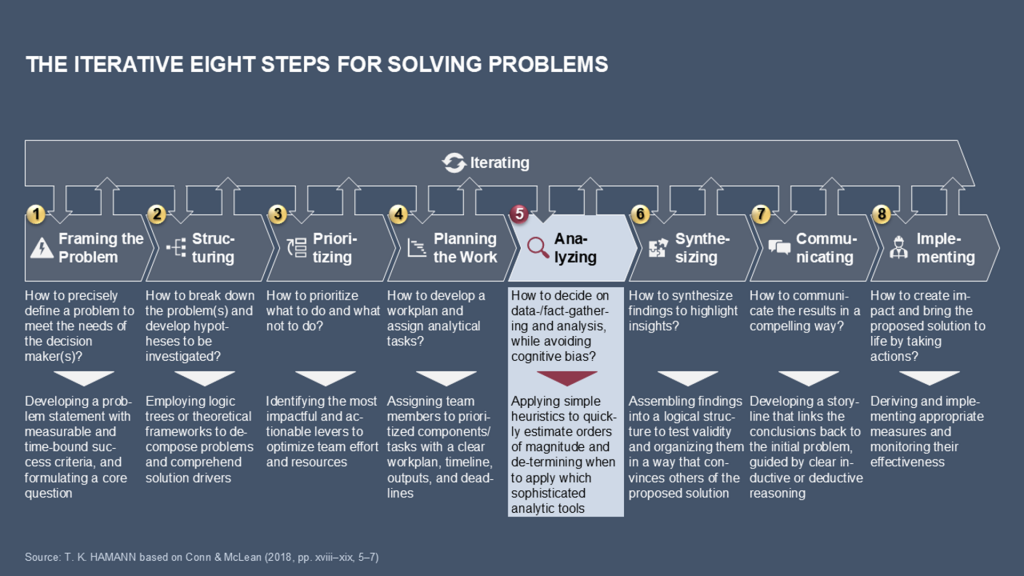
Analysis is the intellectual foundation of problem-solving. It is where preparation meets evidence and intuition is tested against reality. By the fifth step of the Iterative Eight Steps for solving problems, you have completed the following four foundational activities: framing the problem, structuring it, prioritizing it, and planning the work (see Exhibit 1). Each stage narrows the field of inquiry. The problem has been articulated, broken down into components, ranked by impact, and mapped into an action plan. Now, in the analysis stage, those careful preparations transform into discovery.
Professional analysis involves much more than number crunching or data gathering. It is a disciplined, typically hypothesis-driven process of transforming raw information into meaningful insights. In this examination, we will explore analysis as a structured process, beginning with defining its scope, determining the necessary data, collecting and validating it, and conducting quantitative and qualitative inquiries. The principles and practices for managing analysis, heuristics that provide quick insight, and the ever-present dangers of analytical bias will also be explored. Finally, analysis will be positioned within the broader context of problem solving as the basis for synthesis (transforming insights into a coherent narrative) and communication (influencing decisions and prompting action).
The best consultants and leaders understand that analysis is an art that blends rigor with creativity, not just technical work. A spreadsheet model is only as valuable as the insight it provides, and a qualitative interview is only as useful as the patterns it reveals. The following explanations will help you master this balance, teaching you to approach analysis systematically while remaining open to discovery.
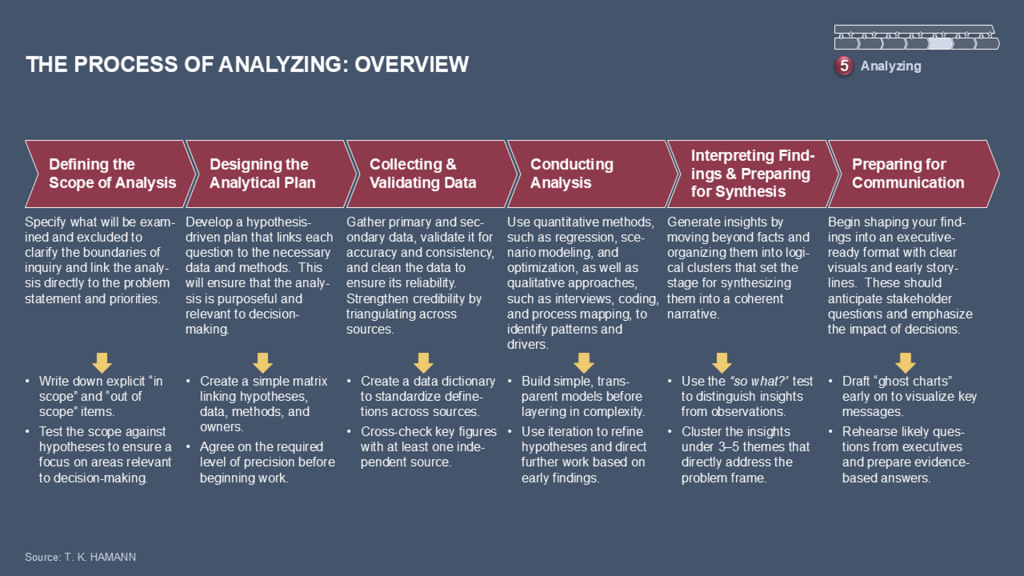
To situate analysis within a broader problem-solving approach, it helps to view analysis as a structured process consisting of distinct yet interconnected steps. Each step builds on the previous one, progressing from defining the examination scope to preparing insights for synthesis and communication. Exhibit 2 summarizes this process.
1. Defining the Scope of Analysis
Analysis begins not with data, but with clarity. The first question is deceptively simple: “What exactly do we need to know?”
The scope of the analysis defines the boundaries of the inquiry, including which questions will be answered, which variables will be examined, and what will be excluded from the study.
The scope is informed by the first four steps of the Iterative Eight Steps:
- The problem frame establishes the overarching question and success criteria.
- Structuring breaks the question down into a logic tree of potential drivers and levers.
- Prioritization identifies which branches matter most for impact.
- Planning maps hypotheses to analyses and assigns responsibilities and timelines.
These preceding steps act as filters, ensuring that analysis time is spent where it matters most. Without this level of discipline, teams can fall into “analysis paralysis,” chasing every possible lead instead of focusing on what will influence decisions.
Scope is also dynamic. Teams should view it as a living contract. As early findings emerge, the scope may narrow to concentrate on a surprising driver or broaden to explore an unexpected correlation. The most successful analysts stay nimble, balancing focus with intellectual curiosity.
Example: In a retail client engagement investigating declining profitability, an inexperienced team might study every aspect of the business, from marketing campaigns to supply chain systems, without direction. However, a disciplined team defines the scope based on the two most promising hypotheses: mispriced key products and inefficient inventory turnover. This approach yields faster insights and actionable recommendations, demonstrating that scope definition is as much about exclusion as inclusion.
The best consultants and leaders understand that analysis is an art that blends rigor with creativity, not just technical work. A spreadsheet model is only as valuable as the insight it provides, and a qualitative interview is only as useful as the patterns it reveals. The following explanations will help you master this balance, teaching you to approach analysis systematically while remaining open to discovery.
2. Designing the Analytical Plan
Once the scope is clear, analysts design a detailed plan linking every hypothesis to a specific set of analyses and data sources. Hypothesis-driven analysis is a structured approach in which hypotheses guide the inquiry process, ensuring that data collection and analysis are purposeful rather than exploratory.
This plan answers the following questions:
“Which hypotheses are most critical?”
“What analyses will prove or disprove them?”
“What data is required, and how precise must it be?”
“Who is responsible for each task?”
Importantly, the plan reflects the level of precision necessary for decision-making. Not every question warrants exhaustive analysis. For example, early in a market entry study, “directionally correct” estimates may be sufficient to eliminate less attractive geographies, while the final decision may require a detailed cost model for the chosen country.
This step encourages teams to anticipate constraints in data availability. Hypotheses should be refined based on importance and feasibility. Some questions may be impossible to answer definitively within the project timeline. A hypothesis-driven plan helps teams decide where to invest their efforts.
3. Determining Data Needs
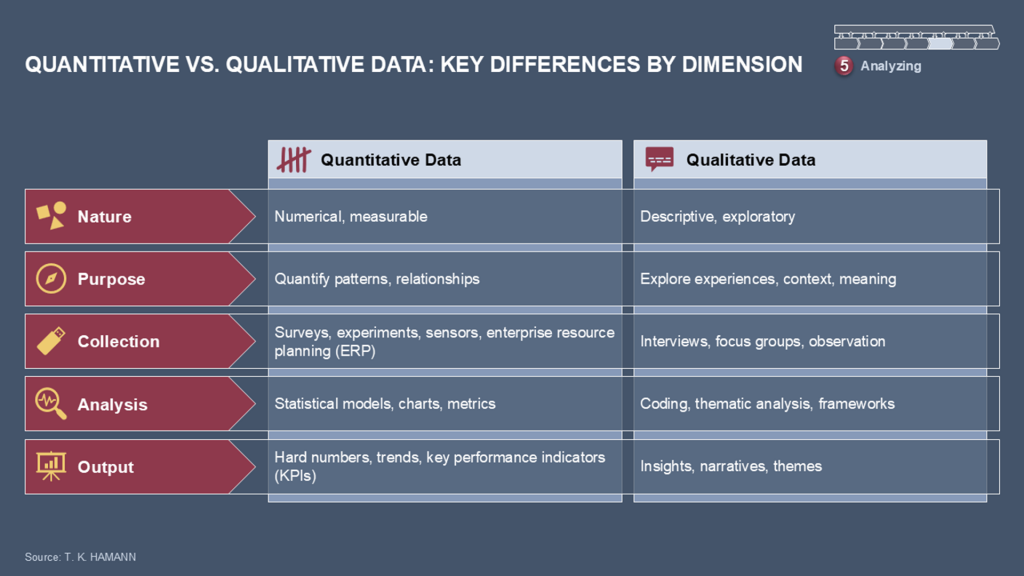
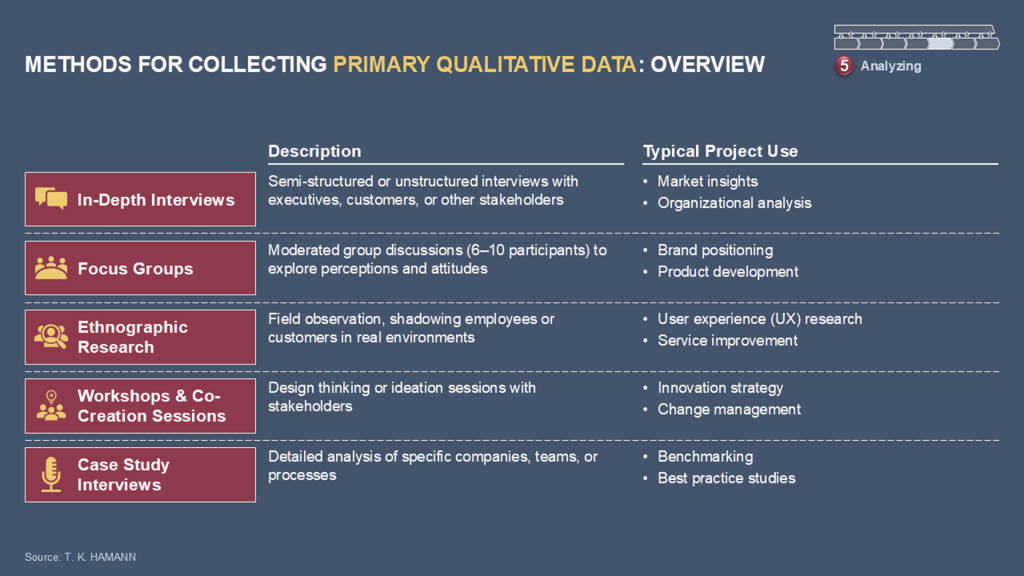
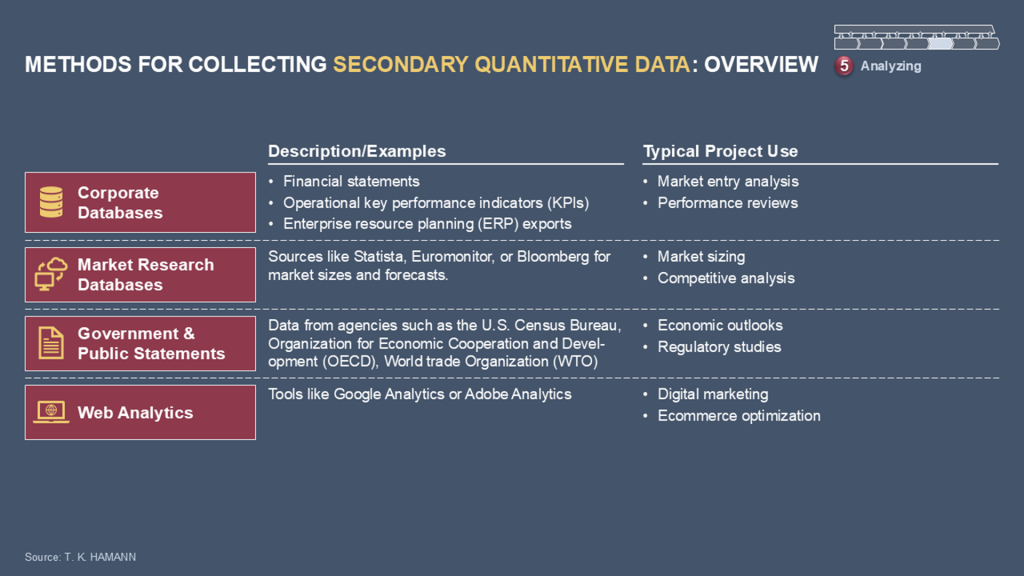
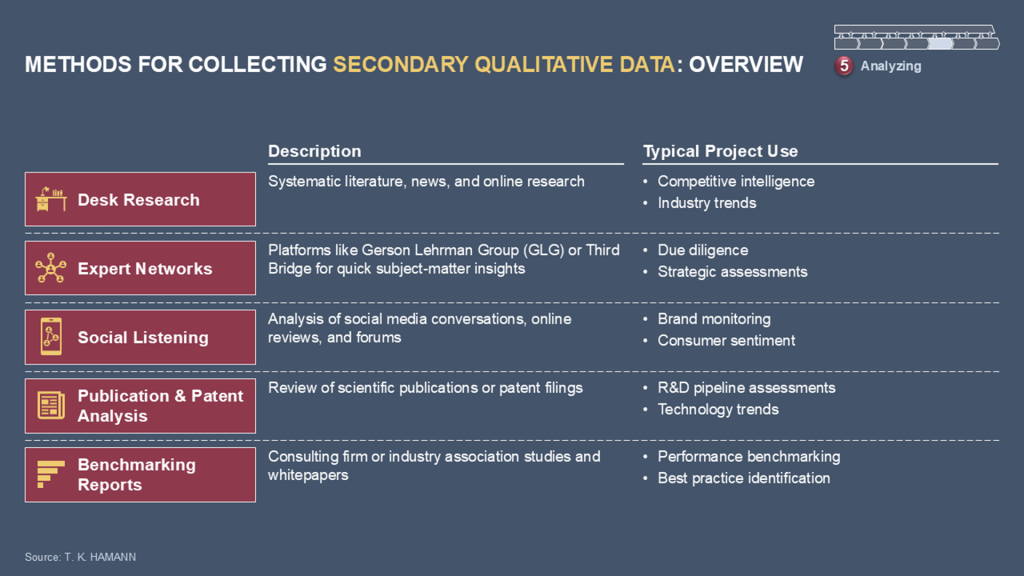
Effective analysis requires the right data, not just more of it. Analysts distinguish between quantitative and qualitative data (see Exhibit 3) and between primary and secondary sources (see Exhibits 4 to 7).
Quantitative data is numerical, structured information such as financial results, production metrics, and survey scores. It enables statistical modeling and precision.
Qualitative data refers to descriptive insights captured through observation, interviews, and narratives that reveal motivations, context, and subtleties.
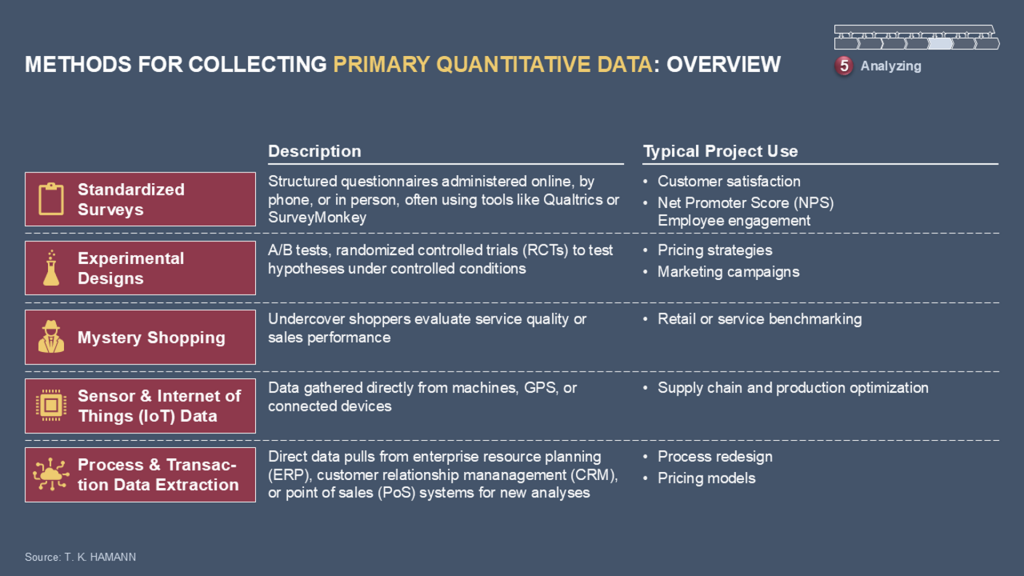
Primary data is collected specifically for a project, such as through tailored surveys, customer interviews, experiments, operational audits, etc. This method offers precision and relevance, but it is time-consuming and costly.
Secondary data comes from existing reports, analyst briefings, internal systems, or public databases. While it is faster to acquire, it requires careful vetting for quality and relevance.
Strategic problem solvers determine which data is necessary and sufficient. For example, an early-stage acquisition screening might rely on secondary data and proxy metrics, whereas due diligence on a chosen target demands granular primary data collection.
4. Collecting and Validating Data
Data collection is an exercise in discipline. The goal is to establish a foundation of reliable evidence, bearing in mind that analysis is only as strong as its inputs.
4.1 Establishing Standards
Teams first establish data definitions and standards. Seemingly small inconsistencies—like one region defining “active customer” differently than another—can render comparisons meaningless. Establishing a data dictionary prevents these errors.
4.2 Triangulation
Triangulation is the practice of cross-validating insights through multiple independent sources. If one data source suggests customer dissatisfaction, analysts confirm it with Net Promoter Score (NPS) trends, social media sentiment, and call center logs. Triangulation creates confidence, even when individual datasets are imperfect.
4.3 Data Cleaning
Data cleaning involves detecting and correcting errors, inconsistencies, and gaps in datasets to improve their quality and reliability.
Although data cleaning is often invisible to stakeholders, it is crucial. It includes:
Removing duplicate records
Handling missing values through imputation or exclusion
Correcting obvious errors (e.g., negative ages in customer data)
Harmonizing formats (e.g., standardizing currencies and date formats)
In one financial services project, a consulting team discovered that a client’s “customer churn rate” had been inflated due to double-counting of account closures across two systems. Not only did cleaning the data fix errors, but it also reframed the client’s perception of risk, saving millions in unnecessary retention spending.
5. Principles and Practices for Managing Analysis
In practice, analysis is rarely a solitary effort. It is a team-based activity involving multiple analysts, consultants, and experts who work under tight deadlines and face high expectations. To maintain quality and speed, leading firms adopt a set of principles and practices that govern how analysis is conducted. These principles and practices are not rigid rules, but rather shared norms that bring structure and discipline to what might otherwise become chaotic or fragmented.
The first principle is to work backward from the storyline. Before data collection even begins, teams draft “ghost charts”—rough sketches of the expected final message’s slides or visuals. These charts clarify the analytical question and its potential answer, ensuring that every analysis is connected to a decision and does not become an isolated calculation.
Another practice is to prioritize relevance over perfection. Since time and resources are limited, it is not possible to answer every question with absolute precision. Therefore, analysts must judge what level of accuracy is sufficient for decision-making. As a common consulting maxim puts it: “It’s better to be approximately right than precisely wrong.”
A third principle is iterative transparency. Teams share emerging results early and often. This allows hypotheses to evolve and mistakes to be caught quickly. For example, an early model shared after a few days may reveal an incorrect assumption that can be corrected before weeks of effort are wasted.
These principles are reinforced by operational practices that keep analysis organized and reliable: disciplined file management, standardized model design, short daily team check-ins, and structured peer review of calculations and logic. While they may seem mundane, these practices form the infrastructure of high-quality analysis. They ensure that insights can be trusted, reproduced, and communicated effectively to senior decision-makers.
These principles are reinforced by operational practices that maintain organized and reliable analyses, such as disciplined file management, standardized model design, short daily team check-ins, and structured peer review of calculations and logic. Though they may seem mundane, these practices form the foundation of high-quality analysis. They ensure that insights are trustworthy, reproducible, and effectively communicated to senior decision-makers.
6. Heuristics: Quick Wins and Strategic Shortcuts
Not every question requires a full-scale model or in-depth statistical analysis. Experienced problem solvers use heuristics, or practical rules of thumb that provide quick insights, to prioritize focus areas and accelerate decision-making.
One of the most famous heuristics is the Pareto principle, also known as the 80/20 rule, which states that a few causes often produce most effects. Consultants often use Pareto charts to identify the “vital few” drivers. For instance, a consulting team analyzing procurement spending might discover that 80 percent of costs are associated with only 20 percent of suppliers. This allows the team to focus its negotiation efforts where they matter most.
Another widely used shortcut is the Rule of 72, which estimates the time it takes for an amount to double based on a growth rate. If a business is growing at a rate of 9 percent annually, then dividing 72 by 9 shows that the business will double its revenue in approximately eight years. This heuristic is simple yet helps executives quickly gauge the implications of growth strategies.
Although heuristics are not substitutes for rigorous analysis, they are powerful tools for focusing effort. They allow teams to:
Quickly identify where deep analysis is worthwhile
Create baseline estimates when precise data is unavailable
Test their intuition against simple calculations before investing in complex models
For example, during a private equity due diligence project, a consultant may perform a quick back-of-the-envelope calculation to determine if a potential acquisition will meet the investor’s hurdle rate. If the rough calculation suggests that it cannot, the team can redirect resources to more promising targets.
Using heuristics effectively requires judgment. Analysts must know when heuristics are sufficient and when a deeper analysis is necessary. Overreliance on heuristics without validation can lead to oversimplification.
7. Conducting Analysis: Quantitative and Qualitative
Executing an analysis is where intellectual rigor meets creativity. It is not just a series of calculations, but rather an iterative dialogue between evidence, experience, and reasoning.
7.1 Quantitative Analysis
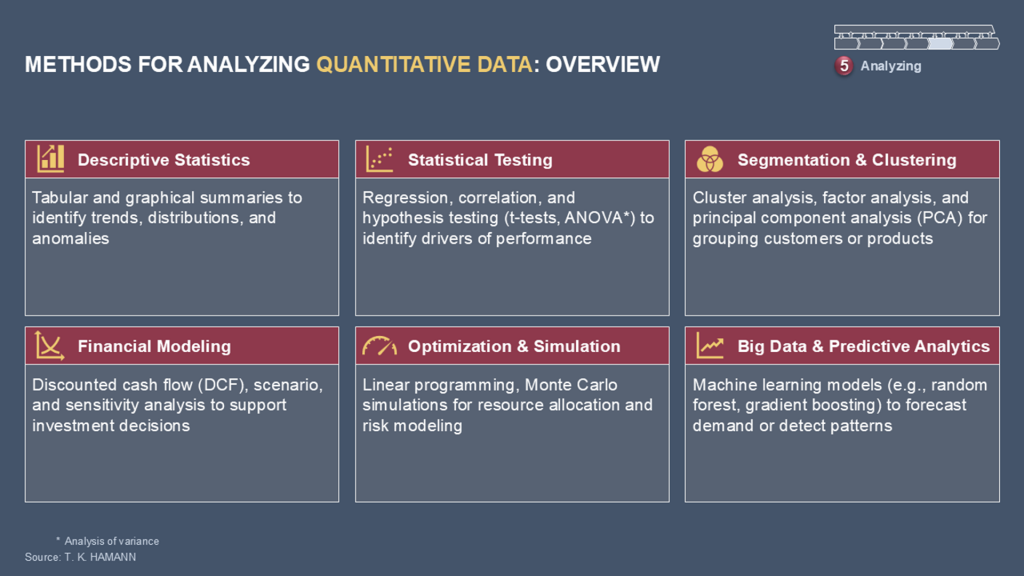
As summarized in Exhibit 8, a wide range of statistical and modeling techniques—from descriptive statistics to optimization and simulation—can be employed depending on the problem at hand, the type of data available, and the level of precision required for decision-making.
Quantitative techniques offer precision and scalability. Teams often start by using descriptive statistics, such as the mean, median, and variance, to develop an initial understanding. They then move on to diagnostic techniques, such as regression analysis, to uncover relationships between variables. For example, in a retail project, regression analysis might reveal that regional sales are more influenced by store location density than advertising expenditure, which could reshape the marketing strategy.
Consultants often use scenario analysis for strategic planning to test resilience under different assumptions. For instance, an energy company considering expansion could model profits under various regulatory regimes and oil price forecasts. Tools such as Monte Carlo simulations can further refine these models by running thousands of iterations to quantify uncertainty.
In operational contexts, optimization algorithms identify efficient resource allocations. Airlines, for instance, use optimization algorithms to design flight schedules that balance profitability, aircraft availability, and maintenance constraints.
Consultants and other problem solvers are increasingly using machine learning to recognize patterns in large datasets. For instance, customer churn prediction models might use algorithms to identify hidden behavioral signals. However, these models must be interpreted carefully. Without context, even the most sophisticated models risk becoming black boxes.
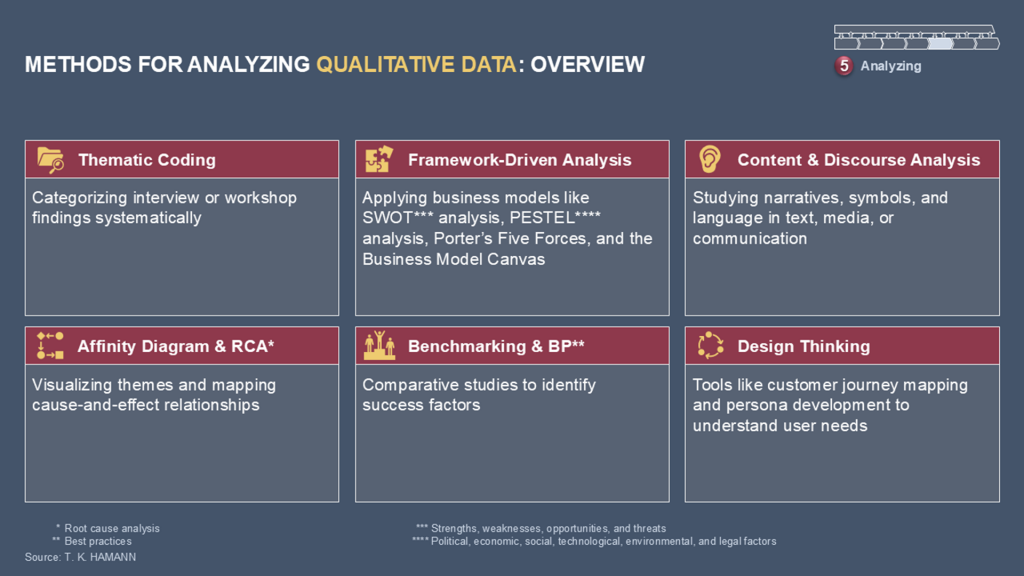
7.2 Qualitative Analysis
While quantitative methods provide scale, qualitative analysis offers depth. It captures the human elements of business, such as customer sentiment, employee culture, and stakeholder motivations. Methods include:
Thematic coding of interview transcripts to identify recurring themes
Customer journey mapping to understand pain points and opportunities
Root cause analysis to uncover systemic operational issues
Exhibit 9 highlights a range of approaches—from interviews and thematic coding to process mapping and ethnographic observation—that allow problem solvers to capture context, behaviors, and underlying motivations often invisible in quantitative data.
Qualitative insights often reveal dynamics invisible in numbers. In one consulting engagement, store managers repeatedly cited employee morale as a reason for high staff turnover. Quantitative HR data showed rising attrition but failed to explain why; interviews uncovered cultural issues that became the core focus of the project.
7.3 Integrating Both Approaches
The best analysis combines both approaches. Numbers identify what is happening, while qualitative insights explain why. In practice, teams cycle between these methods. For example, a spike in returns triggers store visits to identify the cause. These visits reveal that unclear packaging instructions are confusing customers. This information is then fed back into a quantitative model to estimate the cost of returns and the potential return on investment (ROI) of redesigning the packaging.
8. Pitfalls, Biases, and Safeguards
Even seasoned analysts can fall prey to cognitive biases and methodological errors. Designing safeguards against these pitfalls is essential for credible work.
8.1 Confirmation Bias
Analysts often unconsciously seek evidence that supports their hypotheses. For example, a consultant convinced that pricing is the root cause of falling revenue may unconsciously discount contradictory data. To combat this tendency, teams generate counter-hypotheses and assign colleagues to play “devil’s advocate.”
8.2 Data Availability Bias
Teams tend to rely too heavily on readily available data. In a market sizing project, for example, this could lead to a focus on well-documented regions while emerging markets with sparse data but high potential are neglected. Leaders should encourage creativity in sourcing alternative data and triangulating results.
8.3 False Precision
Presenting highly specific numbers, such as projecting a market size of USD 2,734,908,412, creates the illusion of certainty, which can mislead decision-makers. Instead, analysts should present numbers with ranges and transparently explain their confidence levels.
8.4 Misinterpreting Correlation
Correlation does not imply causation. For example, a model might show a relationship between employee training hours and customer satisfaction. However, without context, this could be coincidental. Therefore, analysts must combine statistical rigor with domain expertise.
Safeguards include peer reviews, structured checklists, triangulation across datasets, and formal model validation steps. Some firms even employ red teams, which are independent reviewers tasked with challenging assumptions and replicating analyses to uncover hidden flaws.
9. Interpreting Findings and Preparing for Synthesis
No matter how sophisticated it is, raw analysis is not inherently valuable. Its power lies in interpretation, which is the process of translating facts into insights that answer the client’s core question.
An insight goes beyond merely stating what happened. For example, “Sales declined by 12 percent” is a fact. An insight might be: “Sales declined by 12 percent because aggressive discounting by competitors undercut perceived brand value, suggesting a need to reposition rather than match price.” This shift from observation to interpretation enables executives to make strategic decisions.
Preparing for synthesis begins here. Analysts group findings into themes, prioritize key drivers, and identify causal relationships. These clusters will later form the backbone of a storyline. Drafting early “pyramid” structures—hierarchies of key messages supported by evidence—helps teams identify gaps, eliminate redundancy, and establish a logical flow.
At this stage, the team also evaluates the implications of decisions. For instance, if the analysis reveals that a product category is unprofitable, the team will consider not only the financial data, but also the implications for customer loyalty, operational constraints, and brand strategy. Synthesis, which will be covered in later examinations, will formalize this process.
10. Preparing for Communication
While synthesis involves structuring the message, communication involves delivering it effectively. The preparation for communication begins early, during the analysis stage. Teams create visuals that prioritize clarity over complexity, condensing large amounts of data into simple, compelling exhibits.
The goal is to avoid overwhelming stakeholders with information. Executives don’t want to see every regression coefficient or survey response; they want actionable insights backed by credible evidence. Analysts can support this goal by:
Designing storyboards that map the flow of arguments
Iteratively refining visuals to ensure they support a single point per page
Anticipating questions executives will ask and preparing backup material.
This preparation creates a seamless bridge from analysis to influence. By the time a team enters the synthesis and communication phase, the groundwork for a persuasive, insight-driven conversation has already been laid.
11. Conclusion
Analysis is both a discipline and a craft. It requires precision, structure, and operational discipline, yet it also demands creativity, intuition, and judgment. This text explored analysis as a process, covering topics such as defining its scope, planning analytically, collecting and cleaning data, applying quantitative and qualitative methods, and preparing for synthesis and communication. The supporting infrastructure—the principles and practices for managing analysis, heuristics, and safeguards that enable analysts to work quickly without sacrificing quality—was also highlighted. Biases and pitfalls were also examined, recognizing that the best analysts are not those who avoid mistakes entirely but rather those who design safeguards to detect and correct them quickly.
Mastery of analysis transforms consultants and executives into trusted problem solvers. This is where hypotheses become insights and decisions begin to take shape. Future examinations will explore how to build on this foundation, first through synthesis, which transforms analytical findings into a coherent narrative, and then through communication, which brings that narrative to life in the boardroom.
12. Key Takeaways
Analysis is the driving force behind problem solving, transforming structured preparation into meaningful insights. The effectiveness of analysis depends on technical skill, discipline, judgment, and creativity. Several key takeaways emerge from this chapter.
First, clearly defining the scope of the analysis is critical. Without boundaries, teams risk diluting their efforts and overwhelming decision-makers with irrelevant information. A clear scope aligns the analysis with the problem statement and the priorities identified earlier in the problem-solving process.
Second, analysis must be hypothesis-driven and well-planned. Each line of inquiry should trace back to a specific hypothesis supported by an explicit analytical plan. This ensures that the work is purposeful and directly relevant to decision-making.
Third, data quality is paramount. Collecting, validating, and cleaning data are fundamental steps that determine the reliability of any conclusions and are not optional chores. Using both primary and secondary sources, as well as triangulation, strengthens the evidence base.
Fourth, analysis requires principles and practices that support team effectiveness. Practices such as working backward from the storyline, maintaining iterative transparency, and peer-reviewing models help maintain quality under pressure.
Fifth, heuristics provide useful shortcuts. Simple rules, such as the 80/20 principle or the rule of 72, allow teams to quickly gain directional insights, provided they are used judiciously and followed by deeper analysis when necessary.
Sixth, both quantitative and qualitative methods are necessary. Numbers provide scale and precision, while qualitative insights provide depth and context. Together, they offer a more complete picture of reality.
Finally, analysts must be aware of potential pitfalls and biases. Confirmation bias, false precision, and correlation errors are perennial dangers, but safeguards such as peer review and red teaming can protect against them. The ultimate aim of analysis is not data for its own sake, but rather, generating insights that prepare the groundwork for synthesis and communication.
Taken together, these lessons underscore the fact that analysis is both systematic and creative. It requires structure and discipline but also an openness to discovery. Mastering this step ensures that the problem solver moves into synthesis and communication with a foundation of insights that are fact-based and decision-relevant.
References
Conn C, McLean R (2018) Bulletproof Problem Solving (Wiley, Hoboken, NJ).